Think about the everyday stuff around you. Laundry detergents that cut through tough stains. Glass windows in new homes that sparkle clear. Even the paper bags at your local store. Sodium sulfate plays a quiet role in all that. It’s a simple chemical, but its reach is wide. As we hit mid-2025, the sodium sulfate market summary shows steady climb. Demand keeps pushing up, thanks to booming industries and smarter production ways.
If you’re in manufacturing, supply chain, or just curious about chemicals, this matters. We’ll dig into sizes, drivers, and shifts. Plus, a close look at how the Mannheim process fits in for sodium sulfate lines—especially those SOP plants. By the end, you’ll see why now’s a smart time to watch this space.
Market Size and Growth: Numbers That Tell the Story
Markets don’t move on hunches. They ride on real demand. For sodium sulfate, 2025 brings a solid base. The global pot sits at about USD 2.28 billion this year. That’s up from last year’s mark, and it’s set to grow.
Projections Through 2030
Look ahead, and the path looks clear. Experts peg the compound annual growth rate at 4.5% from here to 2030. That lands the total at USD 2.85 billion by decade’s end. Not flashy, but reliable. Why? Everyday needs don’t quit. Detergents alone pull in over 40% of use. And with more folks buying washing machines in places like India and Brazil, that slice just fattens.
Short bursts can shake things. A spike in construction? Glass demand jumps. Food packaging up? Paper mills hum louder. These ripples add up.
| Year | Market Value (USD Billion) | CAGR (%) |
|---|---|---|
| 2024 | 2.19 | – |
| 2025 | 2.28 | 4.5 |
| 2026 | 2.39 | 4.5 |
| 2030 | 2.85 | 4.5 |
This table pulls straight from fresh reports. It shows the climb isn’t wild—it’s paced. Plan your buys or builds around it.
What Fuels the Demand: End-Use Breakdown
Sodium sulfate isn’t picky. It fits in detergents, glass making, paper processing, and more. Each spot pulls its weight in the sodium sulfate market summary.
Detergents: The Heavy Hitter
Powdered cleaners lean on it hard. It bulks up formulas, helps dissolve grime. In 2024, this took 43.6% of the pie. Hygiene kicks from the pandemic linger. Plus, e-commerce ships more suds worldwide. In Asia, where laundry habits shift fast, expect this to lead growth.
One factory manager shared last month: “We upped our sulfate orders 15% just to match online sales.” Real talk like that shows the pull.
Glass and Paper: Steady Climbers
Glass makers add it to melt out bubbles. Smoother sheets mean better windows, bottles. With green building on the rise, energy-saving glass eats more. Forecast says this segment hits 4.9% growth yearly.
Paper and pulp? It recovers chemicals in the kraft method. Turns wood chips to strong sheets without waste. Packaging booms as plastic bans spread. Europe leads here, with mills chasing sustainability badges.
- Food and beverage: Thickens dairy, extends shelf life in meats. Global milk guzzling tops 6 billion people now—developing spots drive it.
- Textiles: Dyes hold better, colors pop. Eco-push favors natural types for less runoff.
These uses overlap. A detergent plant might share suppliers with a glass works. Smart chains spot that.
Production Methods: Why the Mannheim Process Stands Out
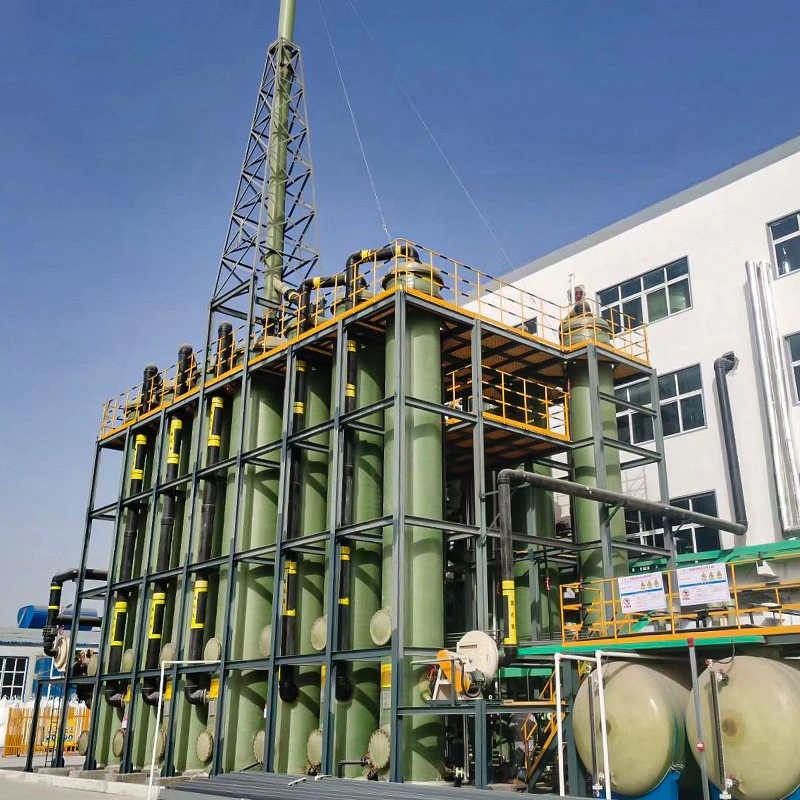
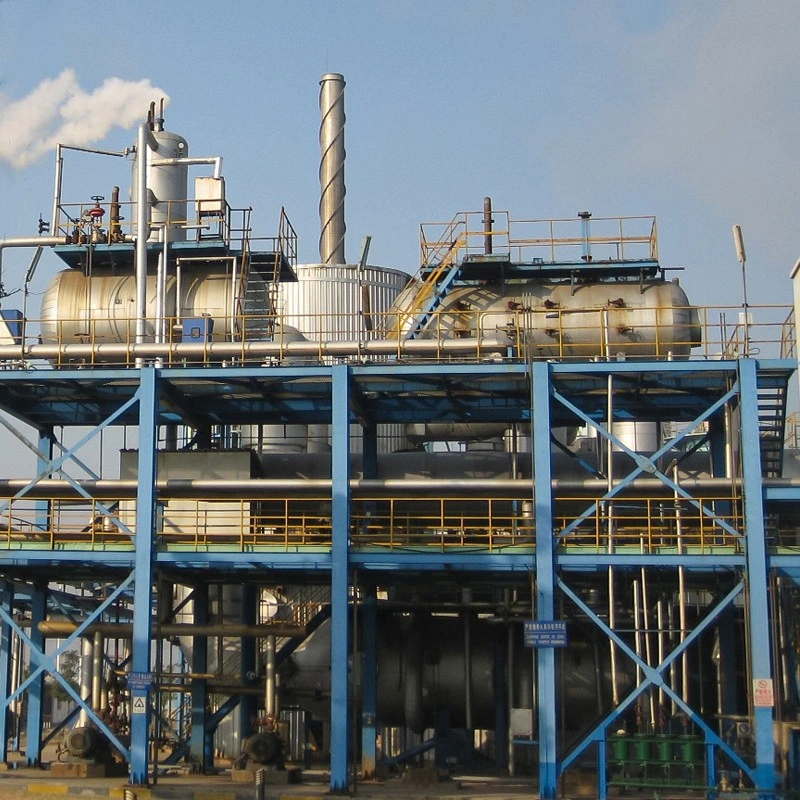
Making sodium sulfate isn’t one-size-fits-all. Natural pulls from lakes or sea spray. Synthetic brews from acids. But for steady, high-volume runs, the Mannheim process shines—especially in SOP plants tied to sodium sulfate lines.
How It Works, Step by Step
Start with salt and sulfuric acid. Heat them in a furnace over 600°C. The mix reacts: 2NaCl + H2SO4 turns to Na2SO4 plus HCl gas. That byproduct? Gold for other chem lines. It’s a two-birds setup.
Furnaces run hot, but tweaks keep them even. Better flues trap heat. New absorbers snag HCl clean. Result? Lower energy bills, greener exhaust.
From the ground up, it’s tough. Early methods wasted fuel. Now, PLC controls tweak feeds on the fly. Output steadies at thousands of tons yearly. One plant in Inner Mongolia hits 160,000 tons of related sulfate, plus 200,000 tons HCl—visitors learn plenty there.
Edges Over Other Ways
Double decomposition? Reactions fizzle, quality dips. Mannheim? Full burns, even heat. Special alloys fight corrosion. Long life means fewer swaps.
- Waste loops back: HCl recycles, cuts pollution.
- Auto systems trim labor—ratios adjust without watch.
- Gas heat beats coal: Cleaner burn, low cost.
For SOP plants, it’s a fit. Ties potassium and sodium runs smooth. Patents pile up on these upgrades. If you’re building a line, this method pays back fast.
Regional Plays: Where the Action Is

Not every spot grows the same. Asia Pacific owns half the board—50.9% in 2024. China and India crank detergents and glass. Urban boom means more homes, more windows.
Asia Pacific: The Powerhouse
Population swells. Factories multiply. E-commerce? Laundry pods fly off shelves. Add construction—skyscrapers need flat glass. This region’s CAGR tops charts.
North America follows. U.S. infrastructure bills pump glass use. Food processing adds steady pull. At 4.6% growth, it’s no slouch.
Europe? Strict green rules favor natural sulfate. Paper mills chase zero-waste. Germany, UK lead.
Latin America and Middle East? Smaller now, but rising. Brazil’s packaging surge helps.
| Region | 2024 Share (%) | Projected CAGR (2025-2030) |
|---|---|---|
| Asia Pacific | 50.9 | 4.7 |
| North America | 18.2 | 4.6 |
| Europe | 22.4 | 4.3 |
| Others | 8.5 | 4.1 |
Maps like this guide expansions. Ship to Asia? Factor port rushes.
Hurdles and Open Doors: Navigating the Twists
Growth has snags. Raw costs climb—sulfuric acid prices wobble. Logistics? Container shortages bite. China feels it most, sparking price wars.
Green Shifts on the Horizon
Enviro rules tighten. Natural sulfate wins for low impact—69.7% share last year. It dyes textiles clean, no heavy metals. Synthetics chase suit with better scrubbers.
Opportunities? New sites pop up. One in Kentucky partners for clean output. Food approvals—like bowel prep kits—open niches.
Trends point sustainable. R&D cuts energy. Diversify apps: From detergents to de-carb glass.
For plants, it’s choice time. Upgrade to Mannheim for efficiency. Or blend natural feeds. Either way, adapt or lag.
A Reliable Partner in Sodium Sulfate Production: Hebei Aoliande Chemical Equipment Co., LTD.
When lines need building, turn to those who know. Hebei Aoliande Chemical Equipment Co., LTD. steps up as a go-to for Mannheim process sodium sulfate production line SOP plants. Out of Hengshui, China, since 2016, they craft full setups—from reactors to absorbers. With 300 staff and ISO nods across quality, enviro, and safety, their gear hits 20,000 tons yearly in related lines.
Exports span U.S. to Egypt. They don’t just ship machines. Design tweaks for your site. Tech chats, material picks, install oversight. OEM? Wide open. It’s hands-on help that turns plans to profits.
Final Thoughts: Positioning for the Sodium Sulfate Surge
The sodium sulfate market summary for 2025 paints a bright path. Steady 4.5% growth rides detergents, glass, and green pushes. Regions like Asia lead, but all spots offer plays. Production via Mannheim? It locks in reliability, especially for SOP-tied plants.
Stay sharp. Watch costs, chase eco edges. Whether you’re running a mill or scouting suppliers, this market rewards the ready. Dive in now—storms brew for those who wait.
Frequently Asked Questions
What’s the outlook in this sodium sulfate market summary for growth through 2030?
Expect a bump to USD 2.85 billion by 2030, with a 4.5% yearly rate. Detergents and glass keep the wheels turning.
How does the Mannheim process fit into the sodium sulfate market summary?
It cranks out high-purity batches from salt and acid, with smart waste recovery. Great for SOP plants chasing steady tons.
Which region dominates the sodium sulfate market summary right now?
Asia Pacific holds over 50%, thanks to factory booms in China and India. North America trails but grows quick.
What drives the biggest slice in the sodium sulfate market summary?
Detergents take 43%, bulking powders for better clean. Hygiene trends and e-sales fuel it worldwide.
Are there green angles in the sodium sulfate market summary?
Yes—natural types lead at 70% share, easier on dyes and runoff. Synthetics tweak for less emissions too.


